Basemap 是Python的一个强大的负责实现地理信息可视化的库,是Matplotlib的一个附加工具包,通过结合matplotlib 可以绘制出很多漂亮的地图。
本文的背景是文章研究区域的作图。
步骤:
1 安装Basemap
操作系统:Mac OS,Python:2.7为了安装方便,本文使用了Anaconda安装Basemap。
首先新建虚拟环境,选择Python的版本是2.7,然后搜索关键字 “basemap”,在结果中选择“basemap”,点击应用按钮,会把Basemap的依赖库 NumPy、PROJ4和GEOS等直接安装,省却了自己命令行安装的烦恼。
此外,Pillow库也可以通过上述方法安装,但不是必需项,还建议安装“basemap-data-hires”库。
安装完毕后,在Anaconda的Home选项卡中,选中下拉框中的安装环境,安装Jupyter,安装完毕,可以启动该程序。
2 绘制地图
2.1 基本地图绘制
%matplotlib inline

from mpl_toolkits.basemap import Basemap
import matplotlib.pyplot as plt
import matplotlib;

map = Basemap()
map.drawcoastlines()

plt.show()
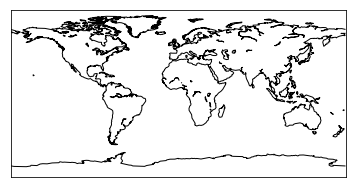
以上代码绘制了世界地图,并绘制了海岸线,地图采用了basemap库自带的数据。
当运行Jupyter绘制地图,但不出现图片时添加以下语句:
%matplotlib inline
2.2 读取shapefile
from mpl_toolkits.basemap import Basemap
import matplotlib.pyplot as plt
import matplotlib;
import numpy as np

#中国地图
map= Basemap(llcrnrlon=73, llcrnrlat=2, urcrnrlon=135, urcrnrlat=55, epsg=3857, lat_0=28,  lon_0=104)
map.readshapefile("/Users/tuo/Data/SDG15_StudyArea/China/China_provinces/China_provinces",  'China', drawbounds=True)

#九段线
map.readshapefile("/Users/tuo/Data/SDG15_StudyArea/China/China_10-dash_line/China_10-dash_line",  'Dash', drawbounds=True)

plt.show()
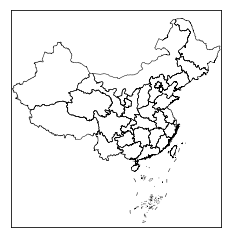
上述代码添加了中国的省份边界及九段线(仅用于测试,准确的边界数据请联系官方),其中Basemap的初始化参数可以设置坐标范围,坐标系以及中心点的坐标,详细的说明请参见官方文档。
2.3 添加指南针、网格线和比例尺,高亮区域
from mpl_toolkits.basemap import Basemap
import matplotlib.pyplot as plt
import matplotlib.patches as mpatches

#添加指南针
def add_north(ax, labelsize=15, loc_x=0.95, loc_y=0.9, width=0.03, height=0.1, pad=0.12):
    """
    画一个比例尺带'N'文字注释
    主要参数如下
    :param ax: 要画的坐标区域 Axes实例 plt.gca()获取即可
    :param labelsize: 显示'N'文字的大小
    :param loc_x: 以文字下部为中心的占整个ax横向比例
    :param loc_y: 以文字下部为中心的占整个ax纵向比例
    :param width: 指南针占ax比例宽度
    :param height: 指南针占ax比例高度
    :param pad: 文字符号占ax比例间隙
    :return: None
    """
    minx, maxx = ax.get_xlim()
    miny, maxy = ax.get_ylim()
    ylen = maxy - miny
    xlen = maxx - minx
    left = [minx + xlen*(loc_x - width*.5), miny + ylen*(loc_y - pad)]
    right = [minx + xlen*(loc_x + width*.5), miny + ylen*(loc_y - pad)]
    top = [minx + xlen*loc_x, miny + ylen*(loc_y - pad + height)]
    center = [minx + xlen*loc_x, left[1] + (top[1] - left[1])*.4]
    triangle = mpatches.Polygon([left, top, right, center], color='k')
    ax.text(s='N',
            x=minx + maxx*loc_x,
            y=miny + maxy*loc_y,
            fontsize=labelsize,
            horizontalalignment='center',
            verticalalignment='bottom')
    ax.add_patch(triangle)
# coding=utf-8
from mpl_toolkits.basemap import Basemap
import matplotlib.pyplot as plt
import matplotlib;
import numpy as np
#matplotlib.use('TkAgg')

plt.figure(figsize=(4, 4))

#map =Basemap()
#中国地图
map= Basemap(llcrnrlon=73, llcrnrlat=2, urcrnrlon=135, urcrnrlat=55, epsg=3857, lat_0=28,  lon_0=104)
provinces_cn=map.readshapefile("/Users/tuo/Data/SDG15_StudyArea/China/China_provinces/China_provinces",  'China', drawbounds=True)

#plt.title("you title name")这样默认是将title加在图像上方,plt.title("your title name", y=-0.1)设置y位置可以将title设置在图像下方
plt.title("(a)", y=-0.2)

#print provinces_cn
#标注云南, China名称默认加 _info就是属性表的名
for info, shape in zip(map.China_info, map.China):
    if info['SHENG'] == 53:
        x, y = zip(*shape)
        map.plot(x, y, marker=None,color='r')
#九段线
map.readshapefile("/Users/tuo/Data/SDG15_StudyArea/China/China_10-dash_line/China_10-dash_line",  'Dash', drawbounds=True)

# 经纬度 网格线
parallels = np.linspace(10,50,5)
map.drawparallels(parallels,labels=[True,False,False,False])
meridians = np.linspace(80,130,6)
map.drawmeridians(meridians,labels=[False,False,False,True])

# 指南针
ax = plt.gca()
add_north(ax)


#比例尺
#https://basemaptutorial.readthedocs.io/en/latest/utilities.html
map.drawmapscale(90, 15, 120, 30, 3000, barstyle='fancy')

plt.show()
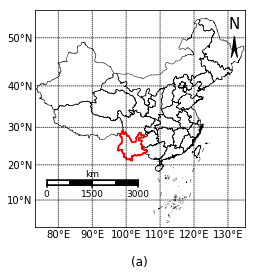
网格线和比例尺可以通过官方的API函数实现,指南针(借鉴他人的代码)和高亮区域需要自己编程实现。
2.4 图例(legend)和属性标注(Label)
# 不规则多边形计算重心点
def get_centerpoint(lis):
    area = 0.0
    x,y = 0.0,0.0

    a = len(lis)
    for i in range(a):
        lat = lis[i][0] #weidu
        lng = lis[i][1] #jingdu

        if i == 0:
            lat1 = lis[-1][0]
            lng1 = lis[-1][1]

        else:
            lat1 = lis[i-1][0]
            lng1 = lis[i-1][1]

        fg = (lat*lng1 - lng*lat1)/2.0

        area += fg
        x += fg*(lat+lat1)/3.0
        y += fg*(lng+lng1)/3.0

    x = x/area
    y = y/area

    return x,y
%matplotlib inline

from mpl_toolkits.basemap import Basemap
import matplotlib.pyplot as plt
import matplotlib;
import numpy as np
from matplotlib.patches import Polygon
import matplotlib.patches as patches
import matplotlib.path as path


plt.figure(figsize=(8, 8))
#plt.figure()
map= Basemap(llcrnrlon=101, llcrnrlat=22, urcrnrlon=105, urcrnrlat=25, epsg=3857, lat_0=23.5,  lon_0=103)

map.readshapefile("/Users/tuo/Data/SDG15_StudyArea/Honghe/AdministrativeCenter",  'AdministrativeCenter')
point_plot=True
for info, AdministrativeCenter in zip(map.AdministrativeCenter_info, map.AdministrativeCenter):
    marker = 'o'
    #plt.annotate(info['NAME'], xy=(AdministrativeCenter[0], AdministrativeCenter[1]), xycoords='data')
    if point_plot:
        map.plot(AdministrativeCenter[0], AdministrativeCenter[1], marker=marker, color='black',markersize=4, label="Administrative Center",ls="")
        point_plot=False
    else:
        map.plot(AdministrativeCenter[0], AdministrativeCenter[1], marker=marker, color='black', markersize=4, markeredgewidth=2)

line_plot=True

map.readshapefile("/Users/tuo/Data/SDG15_StudyArea/Honghe/G80",  'G80', drawbounds=True)
#print map.G80
for info, G80 in zip(map.G80_info, map.G80):

    linex=[]
    liney=[]
    for point in G80:
        linex.append(point[0])
        liney.append(point[1])
    #只向图例写入一次 G80,有时候GIS软件中的一条线在这里会返回多个数据[[],[],[]]
    if line_plot:
        map.plot(linex, liney, label = 'G80', color = 'yellow', linewidth = 1.0, linestyle = '--')
        line_plot=False
    else:
        map.plot(linex, liney, color = 'yellow', linewidth = 1.0, linestyle = '-.')
#map.plot(linex, liney, color='green', label='training accuracy')

#画河流
map.readshapefile("/Users/tuo/Data/SDG15_StudyArea/Honghe/RedRiver",  'RedRiver', drawbounds=False)
Rshapes = {}
for info, shape in zip(map.RedRiver_info, map.RedRiver):
    p= Polygon(np.array(shape), True, facecolor= "none",
                   edgecolor='blue', alpha=0.7, zorder=2, linewidth=2)
    x,y=get_centerpoint(shape)
    #plt.annotate(info['NAME'], xy=(x, y), xycoords='data',color='blue',)
    Rshapes.update({info['NAME'] : p})
    plt.gca().add_artist(Rshapes[info['NAME']])

#画行政区边界
map.readshapefile("/Users/tuo/Data/SDG15_StudyArea/Honghe/HH_Boundary",  'HH_Boundary', drawbounds=False)
shapes = {}
for info, shape in zip(map.HH_Boundary_info, map.HH_Boundary):
    p= Polygon(np.array(shape), True, facecolor= "none",
                   edgecolor='black', alpha=0.7, zorder=2)
    x,y=get_centerpoint(shape)
    plt.annotate(info['note'], xy=(x, y), xycoords='data')
    shapes.update({info['note'] : p})
    plt.gca().add_artist(shapes[info['note']])
    #print np.array(shape)

#plt.title("you title name")这样默认是将title加在图像上方,plt.title("your title name", y=-0.1)设置y位置可以将title设置在图像下方
plt.title("(c)", y=-0.1)

#图例
#x,y = map([103],[23])
#map.plot(x,y, marker="o", color="blue", label="Madrid", ls="")
handles, labels = plt.gca().get_legend_handles_labels()

handles.extend([shapes["Mile"]])
labels.extend(["Boundary"])
handles.extend([Rshapes["Red River"]])
labels.extend(["Red River"])
plt.legend(handles=handles, labels=labels, framealpha=1.,loc=2)
#print labels

plt.show()
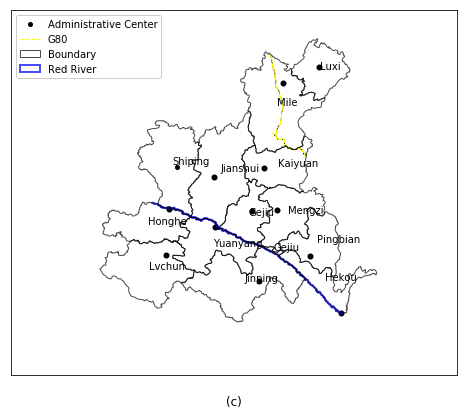
上述代码添加了点、线和面,并使用API函数对这些图层进行了渲染,对各县(多边形区域)的名称进行了标注,增加了图例。
引用
我用Python之basemap画图27问
Basemap Matplotlib Toolkit
使用Basemap添加指南针,显示经纬度刻度
添加比例尺,来自官方文档
不规则多边形计算重心点